TRP Research is proud to work with

Introducing AudEx a suite of innovative solutions for media professionals
Media Visualisation Tool
Available now
Our first product is an online portal allowing you to curate your bespoke view of the media landscape

We’ve done the hard work for you

  • Curated views and widgets
  • Relevant metrics
  • Beautifully designed
  • Data agnostic and scalable

We’ve made it easy for you to find the information you need

  • Online, interactive, immersive
  • Explore, navigate and discover
  • Easily distributable
  • Control who sees what

Design it in a way to suit you

  • You decide the most important info for you
  • Arrange widgets how you want them
  • Save your unique personalised layout and options

Available packages for Visualise

Visualise

Market

10 Market widgets
  • Market Overview
  • Channel Rank
  • Portfolio Rank
  • Schedule Grid
  • Top Programmes As Broadcast
  • Top Programmes As Viewed
  • Share of Commercial Impacts
  • Genre Share of Total TV
  • Platforms Share of Total TV
  • Bubble Chart
Visualise

Channels

9 Channels widgets
  • Channels Overview
  • KPI Comparison
  • Top Programmes As Broadcast
  • Composition
  • Demographics
  • Activity
  • Trend
  • Heat Map
  • Bubble Chart
Visualise

Programmes

10 Programmes widgets
  • Programmes Overview
  • Performance
  • TX List
  • One Off Programmes
  • Series-By-Series
  • Long Running Series
  • Sport
  • Audience Flow
  • Profile
  • Benchmark
Visualise

Market+

Everything in Market, plus:
6 Market+ widgets
  • Total Screen Time
  • Total Audiences
  • KPI For Channel Comparison
  • Top Programmes: Linear V VOD
  • Top Programmes: % Timeshift
  • Top Programmes: % Screen
Visualise

Portfolios

10 Portfolios widgets
  • Portfolios Overview
  • KPI For Channel Comparison
  • Top Programmes As Broadcast
  • Top Programmes As Viewed
  • Channel Rank
  • Composition
  • Demographics
  • Activity
  • Trend
  • Bubble Charts
Visualise

Campaign

10 Campaign widgets
  • Campaign Overview
  • KPI Comparison
  • Reach And Frequency Build
  • Spot Log
  • Regions
  • Demographics
  • Dayparts / Position in Break / Centre v End
  • Sales House
  • Competitors
  • Flighting
Visualise

Market

6 Market widgets
  • Overview
  • Channel Rank
  • Portfolio Rank
  • Schedule Grid
  • Top Programmes As Broadcast
  • Top Programmes As Viewed
Visualise

Market+

Everything in Market, plus:
4 Market+ widgets
  • Total Screen Time
  • Total Audiences
  • KPI For Programme Comparison
  • KPI For Channel Comparison
Visualise

Channels

8 Channels widgets
  • Overview
  • KPI Comparison
  • Top Programmes As Broadcast
  • Composition
  • Demographics
  • Activity
  • Trends
  • Heat Map
Visualise

Portfolios

10 Portfolios widgets
  • Overview
  • KPI For Channel Comparison
  • Top Programmes As Broadcast
  • Top Programmes As Viewed
  • Channel Rank
  • Composition
  • Demographics
  • Activity
  • Trend
  • Bubble Charts
Visualise

Programmes

9 Programmes widgets
  • Overview
  • Performance
  • TX List
  • One Off Programmes
  • Series-By-Series
  • Long Running Series
  • Sport
  • Audience Flow
  • Profile
Visualise

Campaign

10 Campaign widgets
  • Overview
  • KPI Comparison
  • Reach And Frequency Build
  • Spot Log
  • Regions
  • Demographics
  • Dayparts / Position in Break / Centre v End
  • Sales House
  • Competitors
  • Flighting

FAQs

Who is AudEx Visualise for?

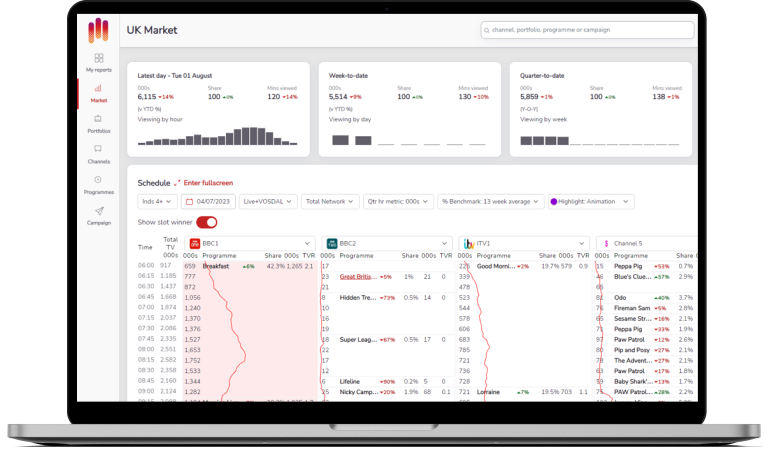
AudEx is an easy-to-use portal, showcasing meaningful media data in a user-friendly way. It is designed to be used by everyone in your organisation, providing access to meaningful data and supporting decision making processes.

How much does AudEx Visualise cost?

Costs vary by number of users and choice of package. We will be happy to discuss the options available with you and design a service to meet your requirements.

Do I need a BARB license?

Yes, AudEx Visualise houses Barb data and you will need a Barb licence to access the portal. If you don’t have one already let us know and we can help you put this in place.

Can I access AudEx Visualise from my phone?

Yes, a mobile optimised portal is available for when you need to access data away from your desk. The mobile version is designed to represent data in an easily digestible format, containing key information for when you’re on the move.

Can I ask for new widgets to be included in AudEx Visualise?

Absolutely, we fully understand there will be some bespoke data or specific views essential to your business that you would like to add. Get in touch and we will be happy to discuss your requirements and put together a likely development timetable.

Request a free demo

Products
About Us
FAQ's
Login
Request a free demo